Understanding the Stock Market Tables
By Ricky So, CIS , RFP®
The stock market page of most newspapers is perhaps the most disregarded section by readers. The reason for this is not a lot of people are into stock investing or are simply not interested in it. Unfortunately, for those who are not reading it, they may have lost a huge market opportunity especially since the bottom of the global crisis in 2008. At the lowest point, the PSE Index registered a low of about 1,750 points in early 2009 to a current level of about 5,200 points as of this writing. Some company stocks listed in the stock exchange have risen from two to five folds in that span of time.
This article intends to enlighten would be readers of the stock market page and possibly help readers understand the different tables presented in the stock section of the newspaper. The different tables are as follows:
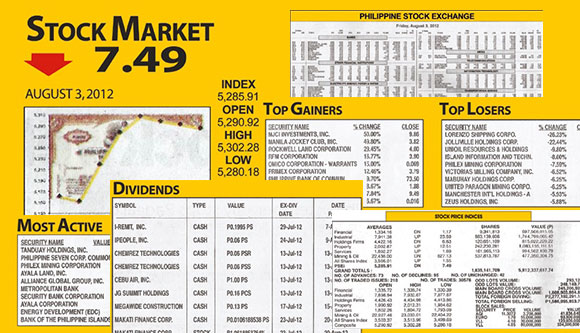
First is the stock index snapshot. It tells the number of “points” the index has risen or fallen on a particular trading day. This item is similarly reported in the evening business news on the TV. One must know that the stock market index for the Philippines is known as PSEi.
It is composed of 30 companies that have met the criteria to be there such as liquidity, free float level and volume traded. One can say that the companies in this index are considered stable, liquid and actively traded in the stock exchange. Therefore, its movement, either up or down, is the average of all the rise and fall of the issues in the index.
Note, however, that each company in the index has a different ‘weighting’ or representation in the index. Say, PLDT with stock code (TEL) has a 14% weighting, this means, its stock movement in a trading day has a 14% impact on the index, up or down. TEL is the largest component of the PSEi. In addition to this, one should note that relevant to this information is the value of trade on that day. It speaks of the level of activity or participation in peso value, and that the higher value traded, the better.
Second is the main stock quotation page. It shows the performance of the individual stocks on a particular trading day. The notable points in the price movement are the open, high, low and close. The open is the first transacted price upon opening of the stock market at 9:30 am. During the trading session, the highest transacted price is the high. Conversely, the lowest transacted price is the low. And when the market closes at 3:30 pm, the last transacted price is the close.
These prices tell the story of the trading of a stock on a particular day, notably, the move from the open to the close. A closing price higher than the open price means that the stock has attracted more buyers than sellers that day. A lower closing price than the opening means the trading session is dominated by sellers. The difference between the high and the low is the trading range where buyers and sellers have stretched the trading in a particular session.
Third is the gainers and losers table. This section shows the list of stocks performance in terms of price movement in a trading day. The top gainers are those issues whose prices went up in a particular trading session. It is the list of ten best performing stock by percentage gain in a trading day. Conversely, the top losers are those issues whose prices went down in a particular trading session. It is the list of ten worst performing stock by percentage loss in a trading day. This section of the stock page shows where the action was.
This however, should not be confused with the most active table. It is the list of top ten stocks with most volume traded in a day with more emphasis of those issues garnering the highest peso value of trades. These stocks are the hotly traded issues based on peso value but may not necessarily end up in the gainers or losers table.
Fourth is the dividends notice section which perhaps interests a number of investors. This section is like a bulletin of upcoming dividend payouts of some companies. Technically, there are three types of dividend payouts: cash, stock and property dividend.
The cash dividend is of course, in cash. When it is a stock dividend, the company issues stocks, just like a dividend in “kind.” An important piece of information one should consider is the ex-date of the dividend. “ex-date” means the date without a dividend. Therefore, if one would like to catch up or would like to participate on the dividend payout, he/she should buy the stock BEFORE the ex-date. Then, wait for the dividend payment on the prescribed date which is about a week or month from ex-date.
The third type of dividend that is rarely given is a property dividend. This type of dividend is in the form of stocks as well but of different company. Say, one time, Megaworld (MEG) issued property dividend to its shareholders by giving shares of Empire East Land (ELI). Note, that (ELI) is a subsidiary of Megaworld, hence, they owned some shares of ELI. Property dividend is usually given in the form of stocks that the issuing company owns. The shares issued are either listed on the stock exchange or not.
Lastly, the stock market has various indices apart from the main index like the PSEi. The Philippine stock market is subdivided into six sectors, namely, financial, industrial, holding, property, services and the mining and oil sectors. This is much like the main index only that it represents the various sectors of the economy which gives the investor of a snapshot of a particular sector’s performance in view of one’s preference and analysis. The listing of companies in each sector can be viewed at the website of the PSE at www.pse.com.ph.
In conclusion, the stock market tables are tools of information of what transpired in the stock market. It provides a bigger impression of what is happening in the whole economy. As the saying goes, “the stock market is a reflection of the country’s economy” is true indeed. One can find this useful in assessing the economy and possibly spot opportunities to make money by investing or trading stocks.


*Images are sourced from the Philippine Star Business Section. Updated stock market tables are available on the Philippine Stock Exchange website.
Ricky G. So, CIS, RFP® is an SEC Certified Investment Solicitor (CIS) and a Registered Financial Planner (RFP®). He is an Independent Financial Adviser affiliated with Rampver Strategic Advisors. He conducts investment seminars such as stocks, bonds, mutual funds, technical analysis apart from money management programs. He is an eligible SEC Certified Securities Representative after passing the exam in 2011. He lectures at the AIM EXCELL Program on portfolio management and at the RFP Philippines Institute as well. Currently, he is a training consultant to several financial institutions, specializing on investment education and personal finance. He is a financial literacy advocate and an aspiring life coach. Ricky provides in-house training, seminars, investment advisory, financial planning and solutions. He can be contacted through rickygso@yahoo.com or through his mobile 0918-9263538.


I am interested to start investing on stock market. How can i start?
What does the “VOLUME SECTION” represents in the PSEi? Thank you. 🙂